Inorganic Chemistry Laboratories Home Page
 

Back | Contents | Next

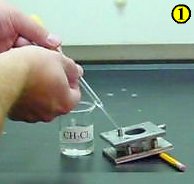
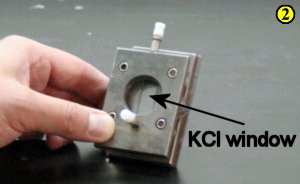
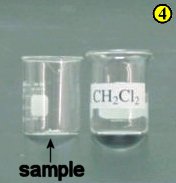
Preparing a Solution IR Sample

Samples that are soluble in suitable organic solvents may be recorded in solution. Special sealed cells are used for this application. The two KCl IR plates are separated by a spacer (0.1 - 0.5 mm thickness) and the solution is admitted to the cell by the use of two stainless steel ports.

Because the sample is prepared as a solution, you must first obtain a background spectrum of the solvent itself. The solvent background will then be subtracted from that of the (solvent+sample) spectrum. The fact that the KCl plates are held a fixed width apart means that the solvent background can be obtained precisely (in contrast, you cannot subtract Nujol from a Nujol mull because the thickness of the film varies).

A sample IR spectrum of a solid compound in CH2Cl2 solution
Click here to see the corresponding sample recorded as a cast film
Click here to see the corresponding sample recorded as a Nujol mull

Because the solvent will absorb in certain regions of the IR spectrum, it is important to choose a solvent that does not absorb in the region of interest. CHCl3 and CH2Cl2 are reasonably transparent to infrared radiation in the region 2800 - 1600 cm-1. If you have selected the solvent wisely, you should find that the baseline is quite flat and very near to 100% T.

  1. Using a disposable pipet, add the solvent (approx. 0.2 - 0.3 mL) through the lower port of the cell until the solution fills the space visible through the plate.
     
    • it often helps to rest the upper edge of the cell on a pencil to provide a slight tilting of the cell away from the horizontal - this will prevent the formation of any air bubbles within the cell
       
  2. Place the teflon stoppers in the ports and record the background.

1. Fill the sealed cell with solvent

2. Seal the cell with teflon plugs

  1. Empty the solvent from the cell.
  2. Dissolve a few milligrams of your compound in approximately 0.5 mL of the solvent

3. Empty the solvent from the cell

4. Dissolve a few mg of the compound in the solvent

  1. Repeat steps 1 - 3 with the solution, this time recording the sample spectrum.
  2. Clean up.

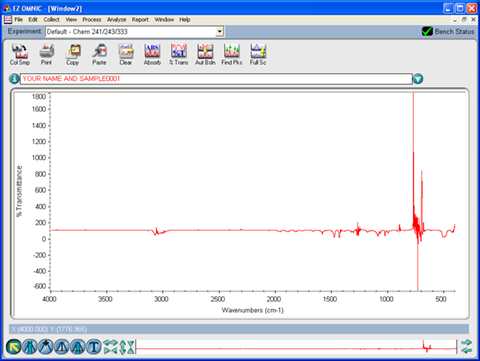
A Few Practical Problems to Watch For

  • if you record your spectrum over the full range (4000 - 500 cm-1, it will initially appear with a nonsensical %T range and large "spikes" where the solvent absorbs strongly. The spectrum will appear more "normal" once the frequency and/or %T ranges are reduced to an appropriate region.

    The way a solution IR spectrum looks initially before the range is set
    This is the way a solution IR spectrum normally appears - you have to set the Y-axis range manually

  • you may need to adjust the concentration of your solution (by either adding more solid or more solvent) if the bands are too weak or too strong - it is suggested that you modify the concentration so that the most intense peak falls between roughly 40 - 10% T
  • if the solution is not concentrated enough, you may miss weak peaks
  • on the other hand, if the solution is too concentrated, you may not be able to distinguish intensity differences that might be important in your analysis
  • if you did not record the background properly, or if you removed the cell from the sample compartment before the spectrometer finished scanning, peaks from the solvent might appear in your spectrum

Top

Back | Contents | Next


Contact the Webmaster
Last modified: Monday, February 28, 2011
© Department of Chemistry, University of Alberta
Disclaimer

Creative Commons License
This work is licensed under a Creative Commons
Attribution-NonCommercial-NoDerivs 3.0 Unported License