Inorganic Chemistry Laboratories Home Page
 

Back | Contents | Next

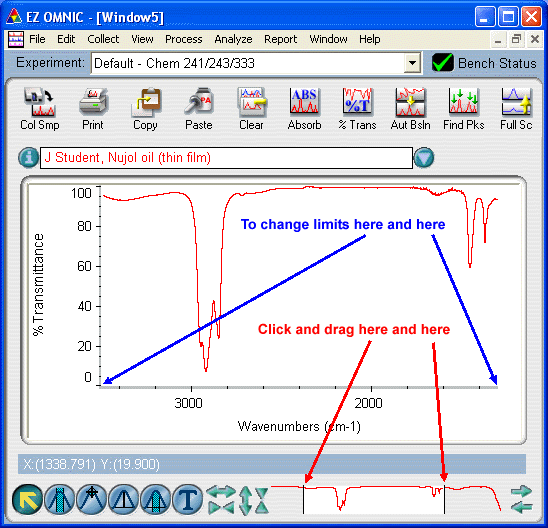
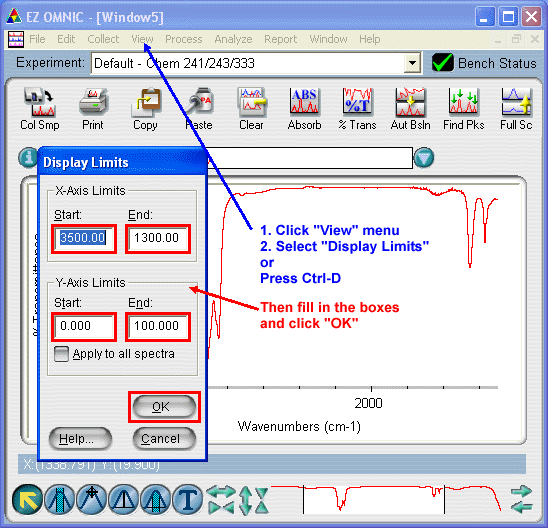
Changing the Display Range

The %Transmittance (%T) range of the spectrum is a good indicator of how well your sample was prepared. If a signal falls at 100 %T, all IR radiation is passing through the sample (i.e., no IR radiation is absorbed).

Theoretically, the baseline of the spectrum should then fall at 100 %T (in practice, anything within about ± 20% of this is acceptable, except for solution samples where the baseline should fall very near the ideal value). Conversely, maximum absorbance is 0 %T (i.e., all IR radiation entering the sample is absorbed). Signals with an intensity of 0 %T must always be considered as having exceeded the range of the spectrometer. For more details, consult the troubleshooting page.

There are two ways to change the display range of the spectrum:

  • Click and drag the left and right markers in the compressed spectrum view along the lower right portion of the screen. A box will appear indicating the wavenumber range that will be displayed when you release the mouse button. You may return to the full spectrum view by dragging the markers to the edges of the compressed spectrum view.

Adjusting the display range using the compressed spectrum view

  • Alternately, press Ctrl-D or select the Display Limits choice from the View menu. Enter the desired X- and Y-axis values and click the OK button. The desired spectral range will now be displayed. You may return to the full spectrum view by resetting the X-axis limits to 4000 and 400 cm-1 and the Y-axis limits to 0 and 100 %T.

Entering the display limits manually

You may execute peak picks and print commands as you would for the full spectrum.

Top

Back | Contents | Next


Contact the Webmaster
Last modified: Monday, February 28, 2011
© Department of Chemistry, University of Alberta
Disclaimer

Creative Commons License
This work is licensed under a Creative Commons
Attribution-NonCommercial-NoDerivs 3.0 Unported License