| |
Back | Contents | Next
Picking Peaks
Peak picking means attaching a label that provides the position (in cm-1) of the peaks on the spectrum. The frequency information is not shown on the computer screen, but is provided when the spectrum is printed.
An automated routine can be used to pick the major peaks in the spectrum (but the fact that the computer picks a peak is not an indication that the peak must be identified by you; the computer picks peaks based on a mathematical routine, not chemical expertise). Peak picking is a useful tool for spectral analysis, so it pays to pick peaks before printing the spectrum.
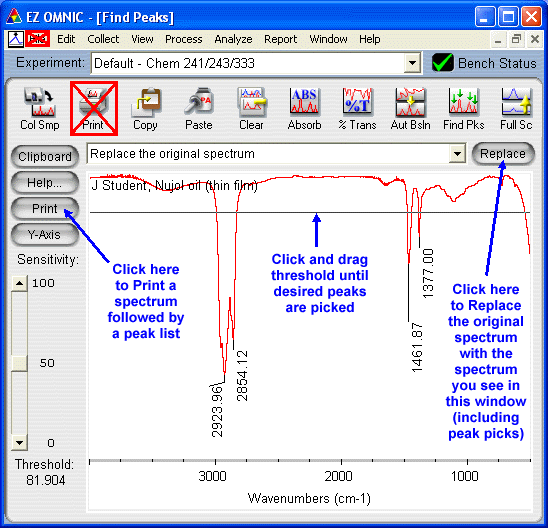
- Click the Find Pks icon on the task bar.

This will set a threshold line for a peak pick of the spectrum. To raise or lower the threshold, click either above or below the present threshold line on the screen.
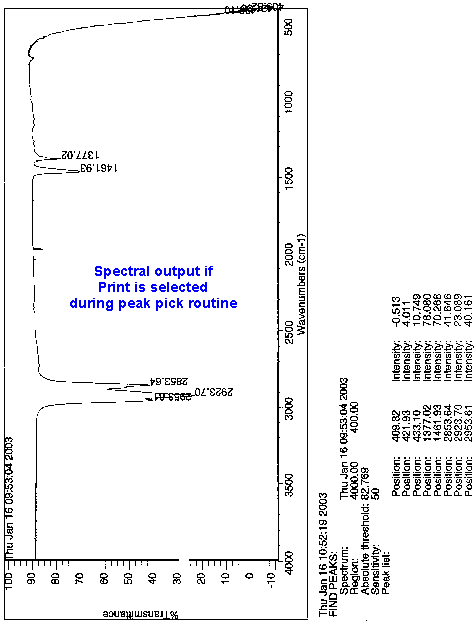
- If you click on the Print button on the left of the screen at this point, both the spectrum and a list of the picked peaks will be printed.
- Do not click the Print icon in the toolbar or select the Print command under the File menu; neither are active at this point.
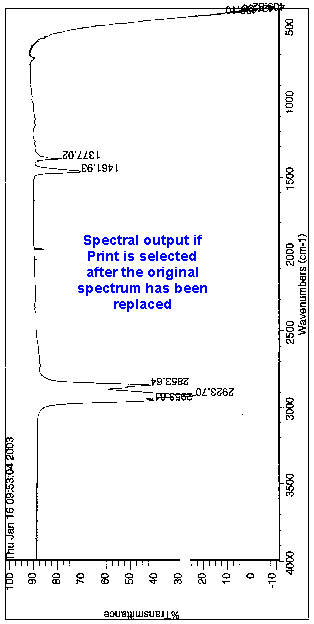
- If you donít want a peak listing but would rather display the picked peaks directly on the spectrum, click the Replace icon on the upper right side of spectrum to replace the original spectrum with one containing peak positions.
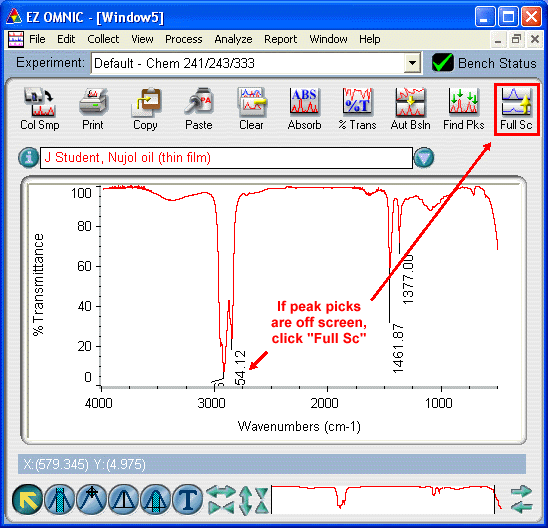
- Check the display to make sure all of the peaks are on scale. If they are not, click the Full Sc button.
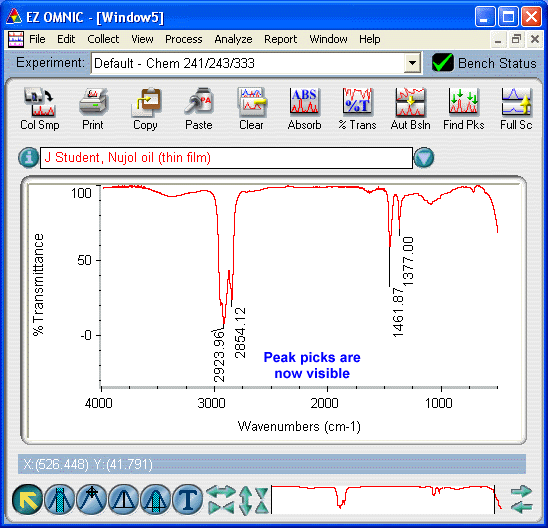
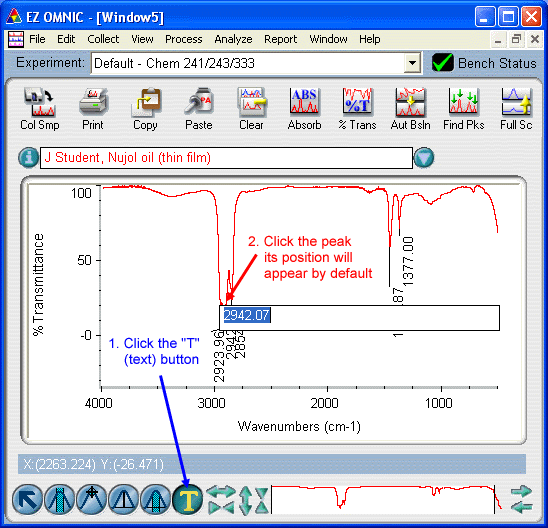
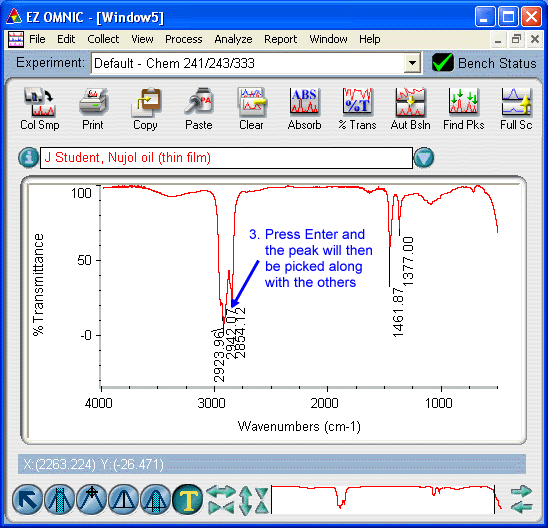
- If some of the peaks you would like labeled on your plot have not been picked by the computer, click the T (text) button in the lower left tool bar and then click on the peak that you would like to pick manually. The text window that opens will default to the peak position (in cm-1). Press Enter to accept the value and pick the peak. If the peak pick overwrites other numbers, you can click and drag it to another location on the screen.
Top
Back | Contents | Next
|
|


