|
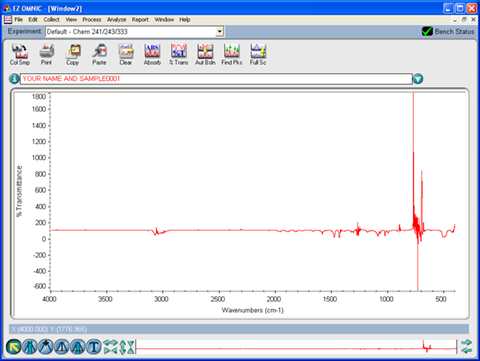
Troubleshooting Problem: I'm recording the IR spectrum of a sample in solution, and the spectrum looks weird - there are large spikes and the range is very different than the usual 0-100%T
|
|||||
|
Contact the Webmaster |
|||||
|
Troubleshooting Problem: I'm recording the IR spectrum of a sample in solution, and the spectrum looks weird - there are large spikes and the range is very different than the usual 0-100%T
|
|||||
|
Contact the Webmaster |
|||||